CAEANALYZE2D command
Runs a 2D Finite Element Analysis.

Icon: 
Description
Runs a 2D Finite Element Analysis for a closed 2D boundary or 3D planar face that must be in the XY plane of the World Coordinate System.
Method
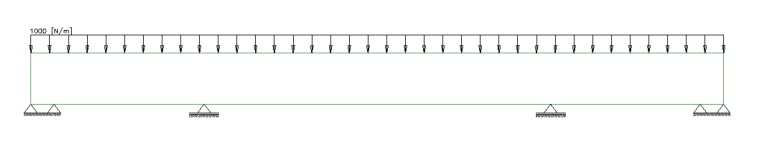
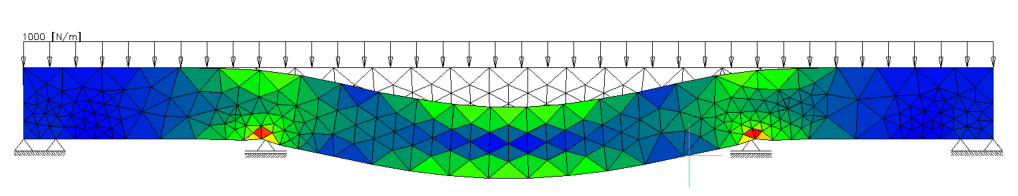
Select a closed 2D boundary or 3D planar face as input to open the Static Analysis 2D command context panel that allows you to define the material and physical parameters, loads and supports, and a mesh for the input boundary. Then run the analysis and visually inspect and interact with the analysis results.
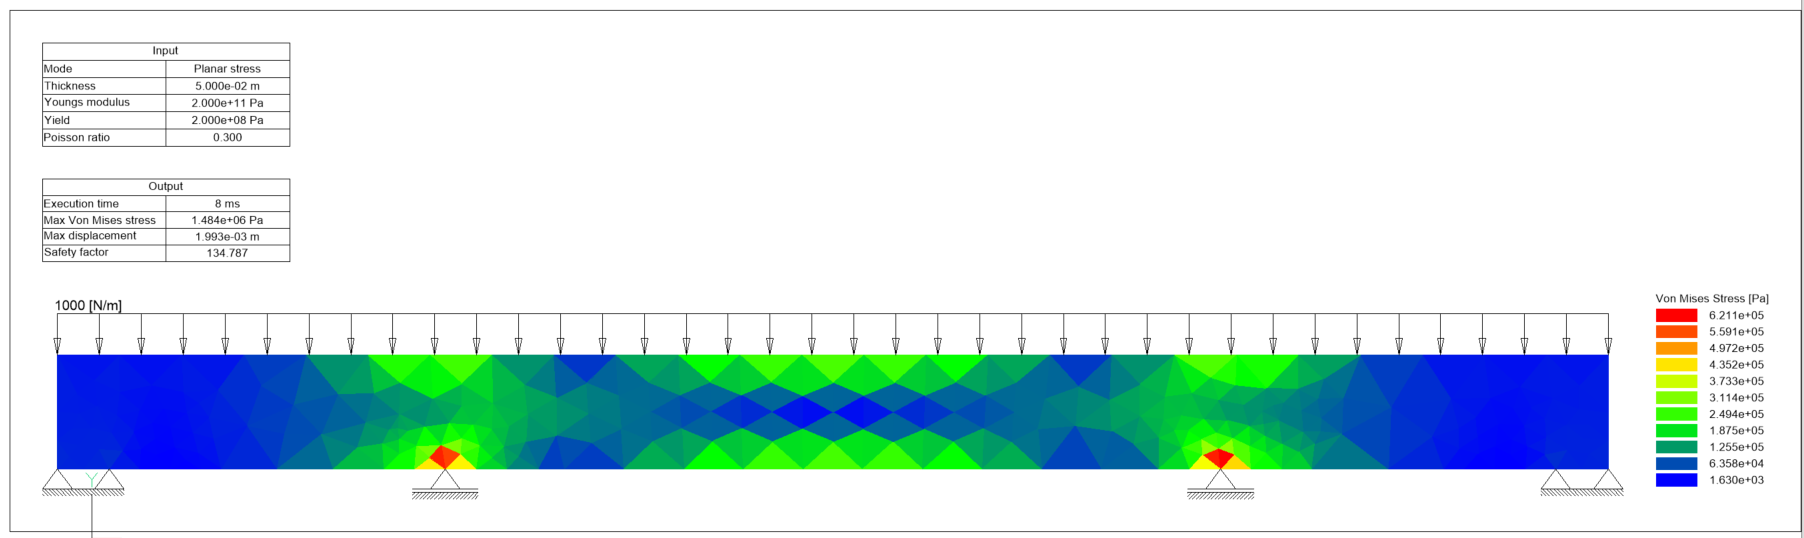
The material and physical parameters include Young's modulus, the Poisson ratio, the yield, and the thickness. Loads include point forces and linear pressures, and supports include point and linear supports. The analysis results contain a summary of the input values, some global output values (execution time, maximum von Mises stress, maximum displacement, and a safety factor), and a colored mesh visualization of the displacement or the Von Mises stresses.
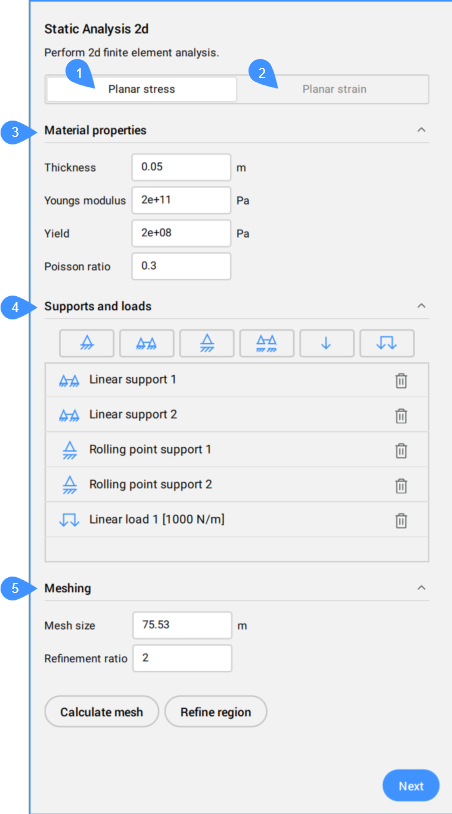
- Planar stress mode
- Planar strain mode
- Material properties
- Supports and loads
- Meshing
- Planar stress mode
- Runs the analysis in Planar stress mode. This mode should be used when the stress tensor is assumed to not have out of plane components.
- Planar strain mode
- Runs the analysis in planar strain mode. This mode should be used when the strain in the Z-direction is assumed to be zero.
- Material properties
- Defines the material properties.
- Thickness
- Defines the thickness of the material.
- Youngs modulus
- Defines the Young modulus of the material.
- Yield
- Defines the Yield of the material.
- Poisson ratio
- Defines the Poisson ratio.
- Supports and loads
- Defines the Loads (point forces and linear pressures) and the supports (point and linear supports, rolling point and linear supports). Loads and supports can be placed over curved entities.
- Point support
- Defines the point support by clicking the point location on the boundary of the region in the drawing. The point support has a graphic representation (symbol) in the drawing.Note: The annotation scale determines the size of the supports and loads symbols in the Model Space.
- Linear support
- Defines the linear support by clicking the first and second point locations on the boundary of the region in the drawing. The linear support has a graphic representation in the drawing.
- Rolling point support
- Defines the rolling point support by clicking the point location on the boundary of the region in the drawing. The point support has a graphic representation (symbol) in the drawing.
- Rolling linear support
- Defines the rolling linear support by clicking the first and second point locations on the boundary of the region in the drawing. The linear support has a graphic representation in the drawing.
- Point load
- Defines the point load by clicking the point location on the boundary of the region in the drawing. Then, specify the angle of the load to the tangent of the boundary (90 degrees by default, for example, perpendicular to the boundary) and specify the point load magnitude. The point load has a graphic representation in the drawing.
- Linear load
- Defines a linear load by clicking the first and second point locations on the boundary of the region in the drawing. Then, you have to specify the angle of the linear pressure to the tangent of the boundary (90 degrees by default, for example, perpendicular to the boundary) and to specify the linear pressure magnitude in. The linear load has a graphic representation in the drawing.
- Graphic representation of the supports and loads:
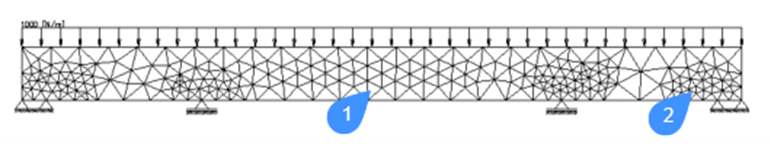
- Meshing
- Defines a mesh for the input boundary.
- Mesh size
- Defines the desired edge length of mesh elements.
- Refinement ratio
- Sets a refinement ration.
- Calculate/update mesh (1)
- Generates the mesh for the given region, mesh size, loads, and constraints. The mesh is shown on the selected region in the drawing. The mesh needs to be updated after changing the mesh size, loads, or constraints.
By pressing Next button, the result of analysis opens:
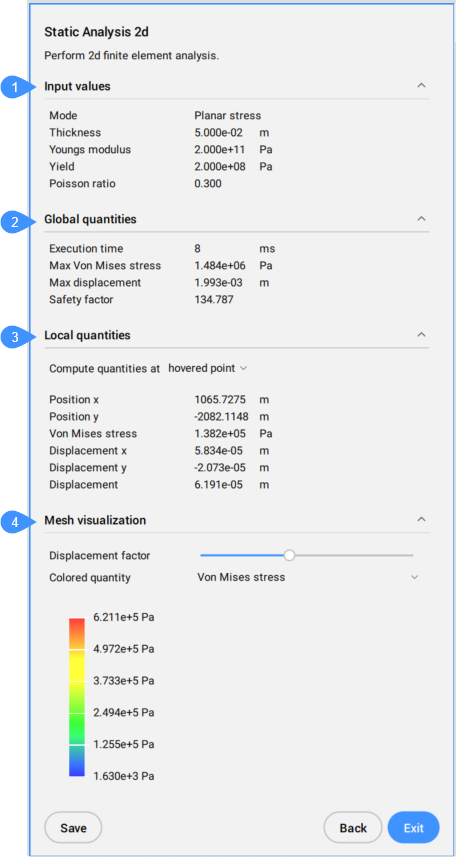
- Input values
- Global quantities
- Local quantities
- Mesh visualization
- Input values
- Displays the input values defined in the previous panel.
- Global quantities
- Displays the calculated output values.
- Local quantities
- Displays the local output values on a specified point. Choose one option from the drop down list, last clicked point or hovered point.
- Position x
- Displays the X position of the point.
- Position y
- Displays the Y position of the point.
- Von Mises stress
- Displays the Von Mises stress in the point.
- Mesh visualization
- Controls the visualization of the results on the mesh.
-
- Displacement factor
- Defines the displacement factor.
The actual displacement of the nodes in the mesh is typically very small and hard to notice in the drawing. The displacement factor can be used to exaggerate the displacement of the nodes in the mesh.
- Colored quantity
- Displays a colormap legend with numerical values for Displacement and Von Mises stress (see the drop down list).
- Save
- Places the analysis results in the Model space.